STATE OF WEST VIRGINIA
PRELIMINARY PERFORMANCE REVIEW OF THE
ADULT PROTECTIVE SERVICES
Response Time Achieved In Only 52% of Cases
OFFICE OF LEGISLATIVE AUDITOR
Performance Evaluation and Research Division
Building 1, Room W-314
State Capitol Complex
CHARLESTON, WEST VIRGINIA 25305
(304) 347-4890
Issue Area 1: Only 52% of Adult Protective Services Cases Were in Compliance With the Requirement to Have Face-to-Face Interviews Within 72 hours of the Initial Referrals.
Adult Protective Services (APS) was established under the Department of Health and Human Resources in 1981. According to West Virginia Code ▀ 9-6-2, the goals of APS may be summarized as follows:
APS workers must choose the least intrusive and restrictive level of intervention. Clients must be allowed the maximum level of self determination as his/her capacity will allow. Adults who are not incapacitated and who can function cannot be forced to accept services, even if this results in eminent danger to the individual. Examples of cases often referred to DHHR under the Adult Protective Services program are for self-neglect/abuse, neglect/abuse by a caretaker, residential abuse/neglect, or financial exploitation. In the cases reviewed by the Legislative Auditor's Office, a majority of the referrals were due to some form of abuse/neglect, as can be seen in Table 1.
Table 1
Reasons for Referrals
| Neglect | 54.2% |
| Abuse | 23.8% |
| Residential Abuse/Neglect | 12.8% |
| Financial Exploitation | 9.2% |
Response Time Standard
DHHR's Social Service Manual sets forth criteria in establishing contact with individuals who have been referred to APS. According to the Manual chapter 29620:
"Investigation of referrals of an emergent nature should be commenced immediately but no later than 24 hours from the time the referral is received by the agency. Investigation of non-emergent referrals should be commenced within 48 hours of the receipt of the referral by the Agency. Additionally, the client must be contacted face to face within 72 hours..."
Increasing Importance of Adult Protective Services
The generation known to many as the "baby boomers" will soon be entering retirement age. This increase can already be seen as West Virginia recently surpassed Florida as having the oldest median population in the United States, which is 38.1 years. As of July 1997, according to the Administration on the Aging, West Virginia was ranked number 2 out of 50 states and the District of Columbia for the percentage of population over the age of 55. The state was ranked 3 and 4 for those over the age of 60 and 65, respectively. Studies done by the West Virginia Bureau of Senior Services show that by the year 2010 over 27.7% of West Virginia's population could consist of individuals over the age of 55. The U.S. Bureau of Census estimates that by the year 2025, West Virginia's population of people over the age of 65 will grow to an astounding 25.9%. It is also estimated that by the year 2025 West Virginia will have the 2nd highest elderly population in the nation. Table 2 shows the increase of the population over the age of 50 over the next ten years.
|
Age |
2000 |
2005 |
2010 |
|
50-59 |
12.2% |
14.2% |
15.0% |
|
60-69 |
8.3% |
8.9% |
10.5% |
|
70-79 |
6.9% |
6.2% |
5.8% |
|
80+ |
3.9% |
4.1% |
4.1% |
As the average age of individuals increases, the number of those requiring services will also increase. The DHHR and APS will need to be prepared to offer these services. Improvement of the current APS system now will enable the state to be more prepared for the increased amount of services that will have to be offered in the future.
APS Case Review and Findings
The Legislative Auditor's Office sampled 386 accepted APS cases in twelve counties across the state. A review of these cases found that a majority of the referrals were female. Figure 1 shows that over 62% of the cases were for females while only 37% were for males. This suggests that women are more susceptible to various types of abuse and neglect. There are various reasons that this could be happening, including but not limited to women having less economic support, or the death of a spouse. The average age of those referred was 67 years.

In addition, statistics show that women have a tendency to live longer than men. The vital statistics for 1995 show that women live an average of 6 years longer than men. The information reviewed also showed that over 32% of the referrals live alone. Table 3 shows the living arrangements of the referrals.
Table 3
Living Arrangements of Referrals
| Alone | 32.6 % |
| With a Spouse | 11.8 % |
| In a Facility | 20.3 % |
| With a Relative(s) | 28.2 % |
| Other | 7.1 % |
All cases that were selected to be reviewed were accepted for investigation by the APS unit. These cases were examined to document whether APS workers were contacting individuals within required time limits, as established by the Social Service Manual. In all cases that are not deemed to be an emergency, APS workers are to meet face-to-face with the client within 72 hours of the initial referral. For referrals that have been deemed an emergency, APS workers are required to meet with the client within 24 hours of the referral.
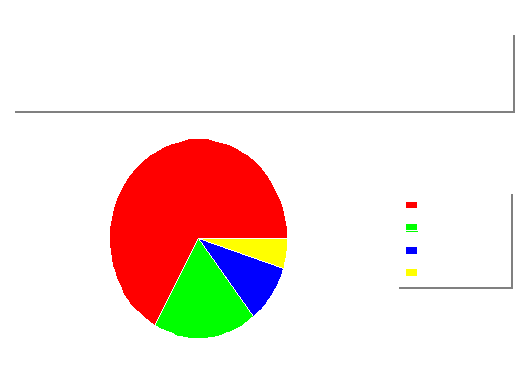
Figure 2 shows that in only 52% of the cases reviewed were face-to-face interviews conducted within 72 hours. In 27.6% of the cases it took 4 to 10 days to conduct the interviews, and in 15.5% of the cases it took over 10 days. Additionally, in nearly 5% of the cases there was no record of a face-to-face interview with the client.

Table 4 shows the average number of days for APS workers of each county in the sample to have face-to-face interviews with clients. As can be seen, Nicholas County had the highest percentage of compliance, meeting the 3 day face-to-face requirement 90.3% of the time, while Summers County had the lowest, meeting the requirement only 23.8% of the time. With respect to the number of cases without a recorded face-to-face interview, six counties had records of face-to-face interviews in all their reviewed cases, while in Preston County legislative auditors were unable to find record of face-to-face interviews in 16.2% of the reviewed cases.
Table 4
|
Average Number of Days to Conduct Face-to-Face Interviews Percentage of cases in the Sample | ||||
|
Counties with High number of Accepted Cases | ||||
| Region I | Region II | Region III | Region IV | |
| Monongalia | Cabell | Preston | Mercer | |
| Interviews within 3 days | 37.5% | 48.3% | 62.2% | 34.3% |
| Interviews in 4 to 10 days | 33.3% | 38.3% | 13.5% | 17.1% |
| Interviews above 10 days | 16.7% | 13.3% | 8.1% | 42.9% |
| Percentage of Cases without record of Face to Face interviews | 12.5% | 0.0% | 16.2% | 5.7% |
|
Counties with Medium number of Accepted Cases | ||||
| Wetzel | Jackson | Taylor | Nicholas | |
| Interviews within 3 days | 65.4% | 46.2% | 57.1% | 90.3% |
| Interviews in 4 to 10 days | 34.6% | 46.2% | 35.7% | 6.5% |
| Interviews above 10 days | 0.0% | 7.7% | 0.0% | 3.2% |
| Percentage of Cases without record of Face to Face interviews | 0.0% | 0.0% | 7.1% | 0.0% |
|
Counties with Low number of Accepted Cases | ||||
| Marshall | Putnam | Morgan | Summers | |
| Interviews within 3 days | 62.5% | 36.4% | 70.0% | 23.8% |
| Interviews in 4 to 10 days | 37.5% | 22.7% | 30.0% | 23.8% |
| Interviews above 10 days | 0.0% | 36.4% | 0.0% | 42.9% |
| Percentage of Cases without record of Face to Face interviews | 0.0% | 4.5% | 0.0% | 9.5% |
Since counties were chosen according to caseloads, those which fell into the high number of accepted cases had very similar caseloads, as in the case with medium and low counties. Despite this similarity, response times differed greatly between the counties. In the counties with a high number of accepted cases, face-to-face interviews were within the 72-hour time limits an average of 45%. This average was approximately the same (44.8%) as those counties with a low number of accepted cases. However, counties with a medium number of accepted cases met the time requirement an average of 68% of the time. Despite a lower number of accepted cases, the low counties were meeting the face-to-face requirements less often than those with a medium number of cases. A correlation analysis was done on the caseload for each county and the percentage of cases that had face-to-face contact within three days to see if there was any correlation between the compliance rate and the level of cases. The analysis showed a relatively small correlation of -0.22. The negative sign was expected, indicating that high caseloads are associated with low compliance with the time standard. However, the correlation was relatively low, indicating that caseload is not a primary factor influencing the ability to meet the time standard.
Time limits for face-to-face interviews were established to protect the prospective client. Abuse/neglect cases can escalate to dangerous levels in a very short time, placing the person at risk. If APS staff are not able to see the client within the required time limits, they are placing the client at a greater risk.
Emergency Cases Meet Twenty-four Hour Face-to-face Requirement in 14 of 21 Cases in the Sample
In the sample of APS cases, the Legislative Auditor's Office found 21 emergency cases. Of these emergency cases, 66% (14 cases) were investigated within the required 24 hour period (see Figure 3). However, 28% (or 6 cases) did not meet the time standard. In these six cases, the number of days to conduct face-to-face interviews were between 2 and 12 days from the initial referral. One of the 21 cases had no record of a face-to-face interview in the file. The Social Service Manual describes emergency cases as those in which a client has suffered severe harm or is at imminent risk of such harm. By not investigating these referrals within 24 hours, the agency is allowing clients to continue to be in danger. However, the agency is responding timely to emergency cases in most cases.

Staffing Levels Could Attribute to Face to Face Requirements not Being Met
In 1997, APS workers began to take over the Guardianship and Health Care Surrogate case load. The addition of these cases added to the overall case load of the APS worker. In order to help with the caseload changes, the DHHR allocated 16 new positions between May and July of 1998. These positions would have been split among the 55 counties in West Virginia. There are currently 408 Guardianship cases and 170 Health Care Surrogate cases statewide.
In 1997, APS received 4,273 referrals which were opened for investigation. This is an average of 356 cases investigated per month. During 1997, there was an average of 43 APS positions, which means that (on the average) each worker picked up 8 cases per month to be investigated. This would not include any ongoing cases that the worker had been assigned. Table 5 shows a breakdown of the number of referrals received per month in 1997, and the average number of referrals each worker handled in a given region.
Table 5
|
Month |
Total Accepted Referrals for 1997 |
APS Positions |
Average Referrals per Worker per Month |
| January | 398 | 42 | 9 |
| February | 351 | 42 | 8 |
| March | 363 | 42 | 9 |
| April | 313 | Data not Available | 7 |
| May | 358 | 41 | 9 |
| June | 358 | 41 | 9 |
| July | 364 | 42 | 9 |
| August | 450 | 42 | 11 |
| September | 350 | 42 | 8 |
| October | 370 | 43 | 9 |
| November | 297 | 47 | 6 |
| December | 301 | 47 | 6 |
| Total | 4,273 | 43 | 8 |
For the twelve counties in the sample, a correlation analysis was conducted on APS Staffing, APS Caseload, and the Compliance Rate (cases with interviews within three days). Table 6 shows the results. Each of the correlations had the appropriate signs. The compliance rate was negatively related to the level of cases of each county, which indicates that counties with relatively large caseload would have lower compliance rates. However, the correlation coefficient was relatively small suggesting that caseload has a relatively small factor in achieving appropriate compliance rates. APS staffing and the compliance rate was positively related, suggesting that counties with greater staffing would be associated with higher compliance rates. Finally, the correlation between APS staffing and APS caseload was a highly positive which indicates that DHHR allocates a higher number of workers to counties with higher caseloads. However, this does not mean that the level of staffing is adequate, only that level of staffing correlates well with the level of cases to be investigated.
Table 6
Correlation Analysis
|
Variables |
Correlation Coefficient |
| APS Caseload vs Compliance Rate | -0.22 |
| APS Staffing vs Compliance Rate | +0.11 |
| APS Staffing vs APS Caseload | +0.80 |
Overall, the correlation analysis shows that staffing and caseload have a relatively small relationship with the compliance rate. This suggests that other factors have a greater relationship with the compliance rate. Other variables could be a high turnover rate among some counties, APS workers having the additional responsibility of the Guardianship and Health Care Surrogate program, or management controls.
Conclusion
With the steady increase of the elderly population in the state, adult protective services also increases in importance. The results of the sample show that the agency is not responding in a timely manner in nearly half of its cases. A correlation analysis between the level of cases, APS staffing and the compliance rate suggests that there are other factors that influence the compliance rate. There are management issues that influence performance of APS investigation. The agency needs to monitor APS response time in the same manner it monitors response times for child protective services. There may be some staffing issues that may have worsened since APS workers have been given the added responsibility of the Guardianship and Health Care Surrogate program. The Department of Health and Human Resources needs to evaluate staffing needs to determine if adequate staffing levels have been provided.
Recommendation 1
The agency should evaluate its resource needs to determine if adequate resources have been devoted to adult protective services to improve response time for a growing elderly population.
Recommendation 2
The agency should closely monitor APS investigations to assure that time requirements are being met.